The classical approach to enzyme kinetics is focused on initial reaction rates. In assays enzymes are mixed with substrate at known concentrations and the rate of the catalyzed reaction is followed. Though the entire reaction progress curve is often experimentally measurable, most commonly only the initial reaction velocity is used. As enzymatic reactions progress there is usually a gradual decrease in the observed reaction rate. The initial rate is conventionally considered the period when 5% or less of the substrate has been converted to product. The initial velocities data can be fit to the Michaelis-Menten equation:
Where v0 is the initial velocity, kcat is the turnover number, Km is the Michaelis constant, [S] is the substrate concentration, and [E]T is the total enzyme concentration. Often, the kcat*[E]T term is grouped together and called Vmax or the maximum velocity. That is, the highest rate of substrate turnover achievable when the enzyme is completely saturated with substrate. Fitting initial velocity data to the Michaelis-Menten equation allows the kinetic constants kcat and Km to be determined. However, although its analysis is considerably more complex, time course kinetics offer even more information about the system. In this article, I discuss all factors which contribute to the time-dependent loss of enzymatic reaction velocity and develop equations for enzymatic reaction progress analysis. Lastly, these systems are generally understood to not have closed solutions. I present a special case wherein a remarkably simple exponential decay solution emerges.
Why do enzymatic reaction velocities decrease over time?
Substrate Depletion
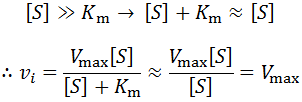
The most obvious explanation for this is that the concentration of substrate decreases over time. The enzyme is catalyzing the conversion of the substrate into a product, which of course depletes the pool of substrate over time. However, substrate depletion will only have an appreciable effect on the rate as when its concentration is no longer saturating (when it is no longer true that [S] >> km). This is easy to see from Michaelis-Menten equation. If [S] is very large:
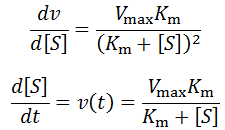
However, once the substrate concentration becomes sub-saturating (e.g. [S] < 10 Km) it will result in a deviation from the initial rate. We can predict the size of the deviation as a function of the change by differentiating the Michalis-Menten equation:
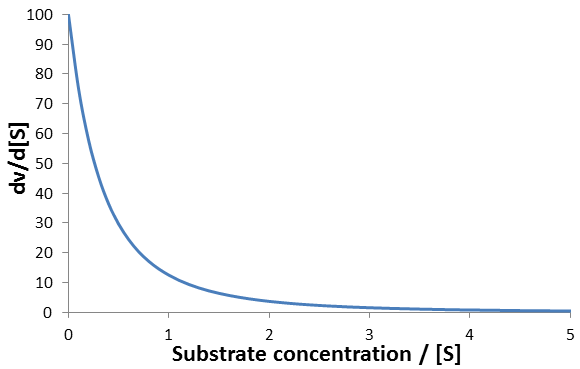
For instance, consider an enzyme with Vmax = 100, Km = 1. A plot of this equation follows below:
The rate of change of enzyme velocity increases as substrate concentration is decreased. This is because at lower concentrations of substrate, changes in its concentration have a larger effect on the free enzyme/substrate-bound equilibrium. Calculating the rate at which the velocity deviates from its initial value is simple enough when we do it in terms of the substrate concentration. However, it is considerably more cumbersome to solve as a function of time, which is what is required for time-course analysis. As the substrate is used up the reaction velocity decreases per the derivative above, yet the rate at which the substrate is used up depends on the current velocity. We can summarize this as the following system of derivatives:
Obtaining a closed solution to equations turns out to be complicated and requires use of the Lambert W function.
Nevertheless, numerical integration is another approach to this and is quite straight-forward to implement. There are also numerous software packages available with can automate this process, such as Mathlab or Excel. In evaluating this numerically, we can define the initial concentration of substrate as [S]0 and the amount that has been used up at time t as the product concentration [P](t). This assumes a 1:1 reaction stoichiometry and that [P](0) = 0. This allows us to write a time course velocity equation:
Nevertheless, numerical integration is another approach to this and is quite straight-forward to implement. There are also numerous software packages available with can automate this process, such as Mathlab or Excel. In evaluating this numerically, we can define the initial concentration of substrate as [S]0 and the amount that has been used up at time t as the product concentration [P](t). This assumes a 1:1 reaction stoichiometry and that [P](0) = 0. This allows us to write a time course velocity equation:
All that is left to do is compute [P](t) as a function of time and we can calculate the time-course velocity. The exact value of [P](t) is given by the integral:
Early in the reaction progress, when the value of v(t) is similar to v(0) we could apply the approximation:
However, for longer time-course analysis this approximation would fail. Instead, numerical integration allows us to accurately determine [P](t) over the full range of t, if the bin size is sufficiently small:
For most assays the actual raw data obtained from a time-course kinetic experiment would be the substrate or the product concentration. We can also obtain the substrate concentration from [P](t):
Product Inhibition
Enzymes often bind the products of the reaction they catalyze. Since this binding occupies the enzyme’s active site it results in competitive inhibition. The enzyme’s active site, once blocked by product binding, cannot bind the substrate thus decreasing the observed reaction rate.
The general initial velocity equation for an enzyme in the presence of a competitive inhibitor is:
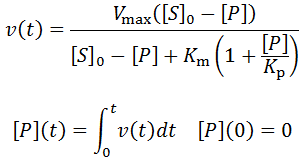
Where [P] is the product concentration and Kp is the competitive inhibition constant, a value relating to the enzyme’s affinity for the inhibitor. We can adapt this equation for time-course kinetics. Firstly, the substrate concentration must be made time-dependent to account for substrate depletion. We can achieve this exactly as we did above with the [S]0 – [P] term. The concentration of the inhibitor is simply the product concentration given 1:1 reaction stoichiometry. Of course, different stoichiometries are possible and merely require the inclusion of stoichiometric coefficients. A further complicating factor is that some enzymes may split a substrate into two or more distinct products, all of which could theoretically inhibit the enzyme. Such a scenario could be accounted for by simply adding additional inhibition terms for each unique product. Although derivations of many imaginable variants are possible, I will develop the equation for the case where one substrate molecule is converted into one product molecule. Thus, the concentration of product formed, [P], is equal to the concentration of substrate consumed.
Solving these equations appears to be an even more challenging than in the case of substrate depletion alone. Of course, numerical integration is still a feasible way to predict the time-course velocity, using:
As before, the time course substrate concentration can be found easily from [P](t):
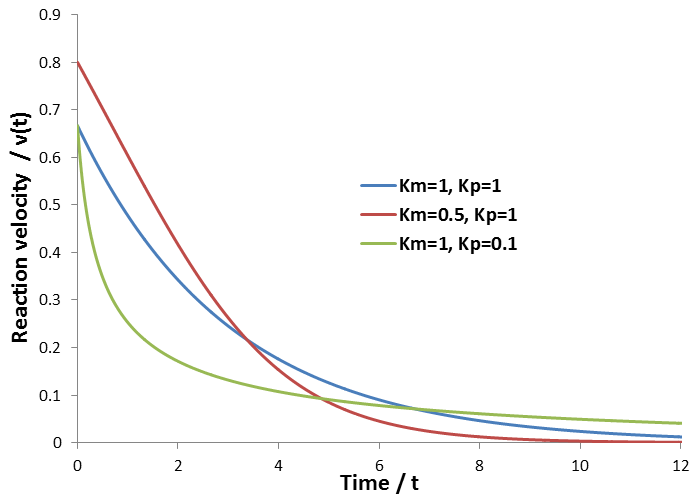
The time-course reaction velocities for a few combinations of Km and Kp values are plotted below, given Vmax=1, [S]0=2:
The relative shapes of these curves agree with what we would intuitively expect. First, compare the blue curve (Km=1, Kp=1) and red curve (Km=0.5, Kp=1). When Km is lowered (red curve), the initial velocity is higher. This is because the enzyme has higher affinity for substrate and a larger fraction of it has substrate bound. Because of this increased velocity, the pool of substrate is depleted faster though. Hence the velocity in the higher Km case (blue curve) eventually overtakes the other. Now we can compare the blue curve (Km=1, Kp=1) and the green curve (Km=1, Kp=0.1). In the case of the green curve, the enzyme binds the product much tighter than the substrate, making product inhibition very significant. Hence the velocity falls much faster early on, as the product concentration is increasing and competitively inhibits the enzyme. This inhibition affords a higher velocity late into the time-course analysis, however, as substrate is depleted much slower.
Reversible Reactions
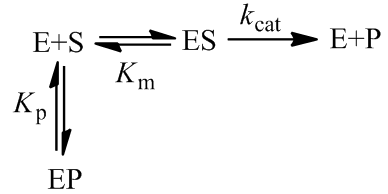
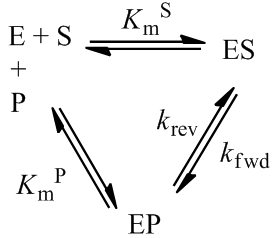
The above treatment of product inhibition assumed that the reaction was irreversible. That is, while the enzyme may bind product, turnover into substrate does not occur. This would be the case for any reaction whose equilibrium lies very far towards product. Of course many enzymes catalyze reversible reactions. Since enzymes are catalysts, they do not actually alter the equilibrium between reactant and product, but merely increase the rate at which it is attained. For the purposes of time course kinetics, the presence of reverse reaction being catalyzed is an additional complication. We can describe a reversible reaction with the following kinetic scheme:
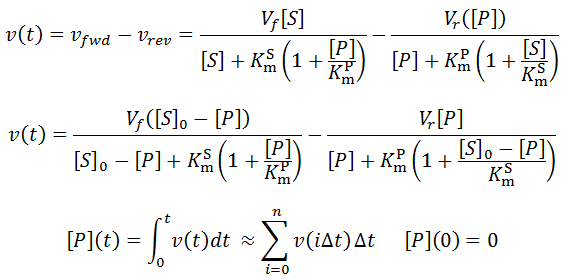
The time course reaction is characterized by competition between the forward reaction and reverse reaction, which depends on the relative concentrations of substrate and product, as well as the equilibrium constant. We can define a positive velocity (v) as net forward reaction and a negative velocity as net reverse reaction:
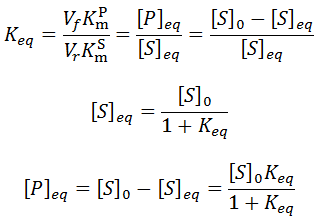
Note that instead of going to completion these equations give the following equilibrium concentrations:
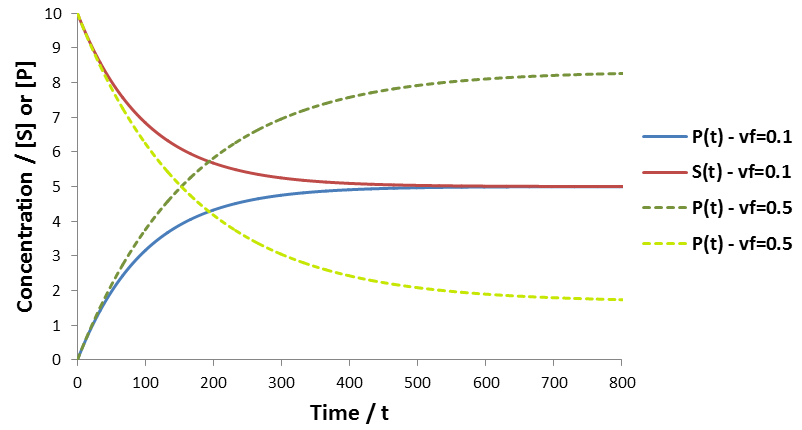
To visualize the time course behavior of reversible reactions a simulation was performed given vf = 0.1 or 0.5, vr = 0.1, KmS = KmP = [S]0 = 10.The results are plotted below:
Instead of proceeding to completion, the system reaches tends toward an equilibrium ratio of substrate and product. The equilibrium concentrations of substrate and product observed in the simulation are exactly identical to those predicted in the above equations. The two cases plotted have different forward velocities, giving different equilibrium ratios.
Enzyme Inactivation
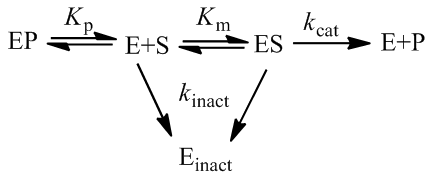
A final factor which may lead to a decrease in observed rate in time course kinetics is inactivation of the enzyme. If, under the assay conditions, the enzyme is unstable, a significant fraction may convert to an inactive form over a time course experiment through a conformational change, misfolding, and/or aggregation. Though more complicated kinetics are possible, enzymatic inactivation often is a first-order process. We can represent this process during a time course experiment as follows:
In this situation, it is useful to distinguish between active ([E]a) and inactive enzyme ([E]inact):
Given the enzyme is inactivated through a first-order process, we can write:
Hence, the active enzyme concentration, and hence the value of Vmax, become a function of time:
Traditional studies to measure the rate of kinact would involve incubating an enzyme stock at the desired conditions and removing an aliquot and assaying its activity at fixed time points. The time course approach offers several benefits over this approach. Firstly, a simpler experiment is required. A single time course experiment can allow calculation of kinact, rather than a series of initial velocity measurements over a range of inactivation times. Additionally, the classical approach is not valid only for highly unstable enzymes. Ths assumption is not required for the time course analysis approach. We only require that enzyme inactivation contributes, at least partially, to the observed kinetics. For instance, if an enzyme is relatively stable we may need to decrease the enzyme concentration until inactivation becomes partially kinetically controlling. It is possible to greatly simplify the analysis by conducting the inactivation experiment well above a saturating concentration of substrate (for instance, suppose [S] >= 100 Km). This ensures that the kinetic contribution of substrate depletion and/or production inhibition should be negligible for a long period of time. This therefore allows enzyme inactivation to be measured in isolation:
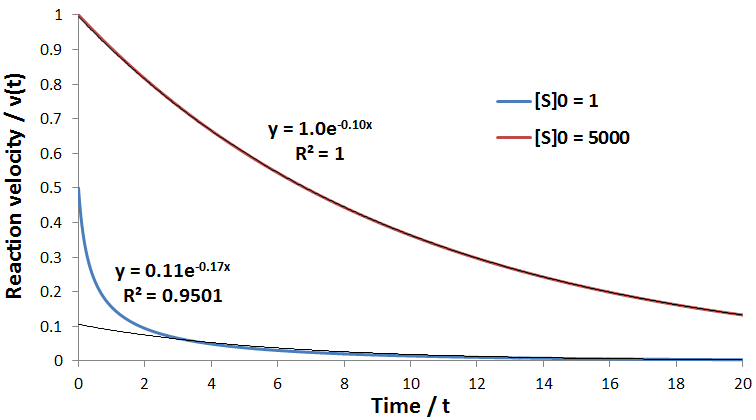
To see the success of this approximation more explicitly, the model was simulated using the following parameters: kcat = [E]T = Km = 1, kinact = 0.1, Kp = 0.1, and [S]0 = 1 or 5000.
As expected at high initial substrate concentration ([S]0 = 5000) the data perfectly follows an exponential decay with rate constant kinact. In contrast, at low substrate concentration ([S]0 = 1) an exponential fit is not suitable to describe the data. This is because high substrate concentration removes the kinetic contributions of product inhibition and substrate depletion, allowing the first order enzyme inactivation to dominate the time course profile. Of course, with this general model, we could directly fit time course data whether or not we simplified the experiment in this way, as long enzyme inactivation contributes at least partially to the observed kinetics.
There are many situations where an enzyme may be inactivated through kinetics more complicated than as presented here. For instance, these equations make the assumption that the free enzyme and the enzyme-substrate complex inactivate at the same rate, which likely is not entirely true. The free energy of substrate binding generally contributes favourably to the overall free energy of folding of the protein and so in practice the rate of kinact to may be slightly slower for the ES complex. At the cost of the model’s simplicity, we could correct for this complication by giving the E and ES complex different rates of inactivation.
There are many situations where an enzyme may be inactivated through kinetics more complicated than as presented here. For instance, these equations make the assumption that the free enzyme and the enzyme-substrate complex inactivate at the same rate, which likely is not entirely true. The free energy of substrate binding generally contributes favourably to the overall free energy of folding of the protein and so in practice the rate of kinact to may be slightly slower for the ES complex. At the cost of the model’s simplicity, we could correct for this complication by giving the E and ES complex different rates of inactivation.
Exponential solutions to enzymatic time course kinetics
Irreversible enzymatic reactions: Km = Kp
We have already seen that kinetics fully controlled by first order enzyme inactivation, not surprisingly, gives an exponential time course profile. However, more generally, enzymatic time course kinetics generally does not have closed, algebraic solutions. Surprisingly, during this study I found a novel special case which affords an algebraic, exponential solution. Consider an enzyme which catalyzes an irreversible reaction with 1:1 stoichiometry and has an equal Michalis constant for the substrate and inhibition constant for the product. Starting with the production inhibition equation, we can therefore let Km = Kp, and so:
As a result of the equal contributions of these constants, the product concentration terms in the denominator have canceled out, leaving a much simpler expression. In fact, the system is now amenable to an algebraic time course solution.
Notice that upon differentiation with respect to time:
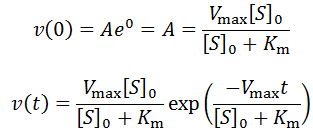
This allows us to deduce that v(t) is equivalently of the form:
We can find the expression for A by recognizing that at t = 0 we expect initial velocity kinetics:
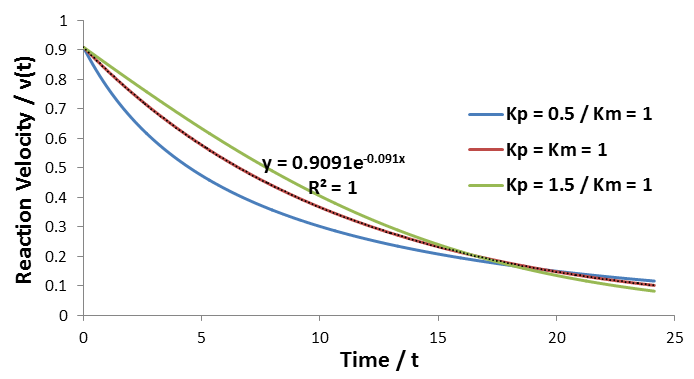
To convincingly show the exponential nature of this special case, I have performed simulations of this model using the parameters: Vmax = Km = 1, [S]0 = 10, Kp = 0.5, 1.0, or 1.5.
As predicted, only in this special case where Km = Kp is an exponential fit suitable (middle curve). If otherwise Kp is higher or lower than Km, the curvature deviates from an exponential trend, as shown.
The relationship between the A and B coefficient when Km = Kp affords a convenient test for consistency of data with this model. Of course during any enzyme assay the initial concentration of substrate, [S]0, is known. As seen for the simulated data, the ratio between these coefficients must be equal to [S]0:
The relationship between the A and B coefficient when Km = Kp affords a convenient test for consistency of data with this model. Of course during any enzyme assay the initial concentration of substrate, [S]0, is known. As seen for the simulated data, the ratio between these coefficients must be equal to [S]0:
Reversible enzymatic reactions: KmS = KmP
An analogous version of the above exponential special case applies for reversible enzymatic reactions. Consider an enzyme which catalyzes a reversible reaction with 1:1 stoichiometry and has equal Michalis constants and affinities for both the substrate and the product (KmS = KmP). There are ample examples of enzymes for which this applies. For instance, many racemases and epimerases are catalytically pseudosymmetric, having similar affinities and catalytic activities towards both enantiomeric or epimeric forms of their substrates. In the above equation for v(t) we can therefore let KmS = KmP = Km, and so:
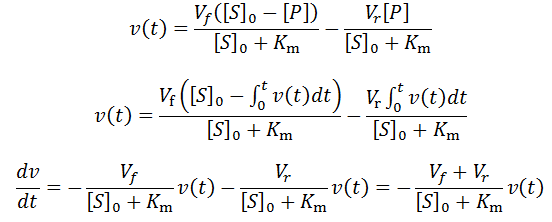
As before, we now deduce that:
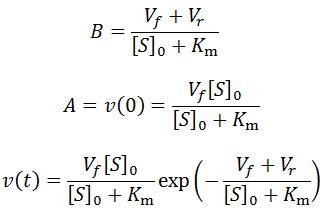
Hence, under these conditions an exponential relationship is obtained for reversible enzymatic systems as well, though the physical meaning of the decay constant is slightly different.
As in the previous case, the relationship the ratio between the A and B coefficients allow a convenient test for the consistence of data with this model. This ratio must be related to the initial substrate concentration by:
As in the previous case, the relationship the ratio between the A and B coefficients allow a convenient test for the consistence of data with this model. This ratio must be related to the initial substrate concentration by:
I have demonstrated that exponential time course solutions can emerge for both reversible and irreversible enzymatic reactions under special conditions. I have only shown this for a 1:1 reaction stoichiometry, it is worth noting that this occurrence is not unique to this situation. Exponential time-course kinetics is expected whenever the apparent product binding term(s) (KmP or KP) is equal to the apparent binding term(s) (KmS or KS) of the substrate for both reversible and irreversible reactions. This is affected by both the number of unique products/substrates and the specific stoichiometry of the reaction. That is, exponential time-course kinetics are possible given any stoichiometry, as long as the binding constants for substrate(s) and product(s) are just right so as to cancel out in the denominator of the time course equation.
Integration of all factors into single model
It is possible to combine the contribution of substrate depletion, product inhibition, reverse reaction, and enzyme inactivation into a single equation:
Notice that all previous equations are actually special cases of this one. Numerical integration allows the computation of v(t) and the parameters could be found by fitting time-course kinetic data to the equation through least-squares regression. Of course fitting all of these parameters to a progress curve had a high risk of overfitting. Thus assays should be performed over a range of enzyme and substrate concentrations and all data used to fit the parameters. Furthermore, for many enzyme systems one or more of these contributing factors may not be applicable and could thus be discarded from the model. For instance, given relatively a stable enzyme and a rapid assay, enzyme inactivation would not contribute significantly to kinetics.
The advantage of initial rate kinetics is its mathematical and conceptual simplicity. Time course kinetics requires significantly more complicated models and analysis. Further, more assumptions must also be made about the properties of the system. The high number of parameters is certainly a limitation of time-course kinetic analysis. The risk of selecting an inappropriate model and analysis of the data is significant, and considerable care with regard to this is required. Nevertheless, a wealth of information about the system is afforded by this technique. In particular, the rate of catalysis, binding affinity of the enzyme for the substrate and product, and the rate of enzyme inactivation are available directly from a single reaction. Using initial velocities alone, determination of all of these parameters would require at several distinct experiments performing many reactions over a range of substrate/product concentrations and incubation times. Though enzymologists normally disregard the data following deviation from initial velocity, I argue that this practice wastes insightful data. I suggest that initial velocity and time course experiments needn’t be distinct. Given time course kinetic data we can calculate Vmax and Km through both the initial rates and a time course analysis, allowing cross-validation of both methods. There are many additional interesting applications of this time course approach. For instance, the mode of action/mechanism of inhibitors can distinguished from time course rate profiles. This will be the topic of a future article.
The advantage of initial rate kinetics is its mathematical and conceptual simplicity. Time course kinetics requires significantly more complicated models and analysis. Further, more assumptions must also be made about the properties of the system. The high number of parameters is certainly a limitation of time-course kinetic analysis. The risk of selecting an inappropriate model and analysis of the data is significant, and considerable care with regard to this is required. Nevertheless, a wealth of information about the system is afforded by this technique. In particular, the rate of catalysis, binding affinity of the enzyme for the substrate and product, and the rate of enzyme inactivation are available directly from a single reaction. Using initial velocities alone, determination of all of these parameters would require at several distinct experiments performing many reactions over a range of substrate/product concentrations and incubation times. Though enzymologists normally disregard the data following deviation from initial velocity, I argue that this practice wastes insightful data. I suggest that initial velocity and time course experiments needn’t be distinct. Given time course kinetic data we can calculate Vmax and Km through both the initial rates and a time course analysis, allowing cross-validation of both methods. There are many additional interesting applications of this time course approach. For instance, the mode of action/mechanism of inhibitors can distinguished from time course rate profiles. This will be the topic of a future article.














 RSS Feed