The cost of TVs depends heavily on their size, with larger ones being progressively more expensive. I examine this relationship by aggregating TV price data over a range of sizes and brands. In addition, I clarify how to calculate TV screen area, height, and width. Though TV screens are universally described by the length of their diagonal, I argue that area is a more intuitive parameter for comparing their sizes.
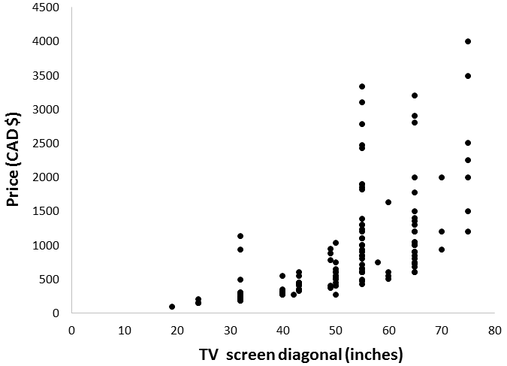
To collect data for this investigation, I consulted The TV section of Walmart’s Canadian website. Here I found 138 TVs listed with screen diagonals ranging from 19” to 75”. I recorded the size and cost of each, summarized in the graph below.
To collect data for this investigation, I consulted The TV section of Walmart’s Canadian website. Here I found 138 TVs listed with screen diagonals ranging from 19” to 75”. I recorded the size and cost of each, summarized in the graph below.
As expected, price increases with TV size. However, size alone isn’t a tremendous predictor. For instance, there were two 32” screen TVs available which were more expensive than many of the 65” screens. We can account for this through the many features which TV models differ in, beyond size. For instance, some have curved screens, some are smart TVs, and others provide 4K ultra HD. Looking at this graph, the distribution of TV models across size is also interesting. Screen diagonals of 50”, 55”, and 65” are by far most abundant. Nevertheless, the confounding factors make it is hard to isolate the contribution of physical size to TV prices from these data. In particular, we’d require the assumption that expensive TV features are equally represented across the sizes.
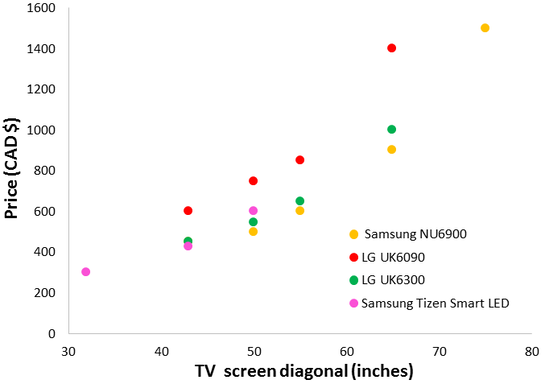
To tease out the relationship between TV size and price, we must compare TVs which are identical in every way except size. Fortunately, it is possible to do this: some companies sell series of TV models which offer the same features at multiple screen sizes. Although this greatly limits the data available, it does conveniently remove the confounding factors. I selected four TV series: two by Samsung (NU6900 and Tizen Smart LED) and two by LG (UK6090 and UK6300).
To tease out the relationship between TV size and price, we must compare TVs which are identical in every way except size. Fortunately, it is possible to do this: some companies sell series of TV models which offer the same features at multiple screen sizes. Although this greatly limits the data available, it does conveniently remove the confounding factors. I selected four TV series: two by Samsung (NU6900 and Tizen Smart LED) and two by LG (UK6090 and UK6300).
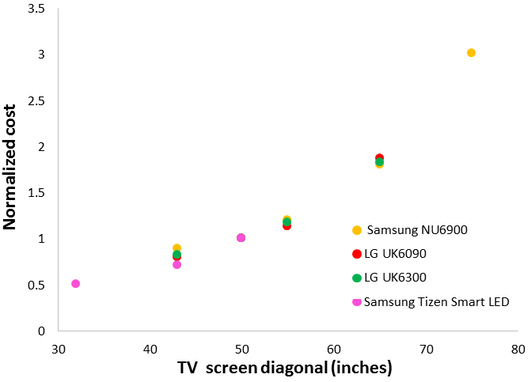
Each series follows a consistent trend, but direct comparison of them is challenging since they have different intrinsic values. In the interest of fully covering the range of screen sizes, it was necessary to combine the data. I normalized the prices within each series to facilitate direct comparison. Each set contained a 50” screen, so I normalized the prices by scaling the 50” option to a value of ‘1’. For instance, The LG UK6300 series costed $448 (43”), $548 (50”), $648 (55”), and $998 (65”). I normalized these prices to 0.82, 1.00, 1.18, and 1.82, respectively. This approach was successful in making each series comparable.
Here a clear relationship emerges between cost and TV screen diagonal length. Interestingly, this relationship is not linear, note the curvature of the apparent trend. As TV screen diagonal is increased, further improvements in size become increasingly costly. We can explain this nonlinearity, to do so we must review how screen diagonal is related to its area.
Calculating TV screen area from diagonal length
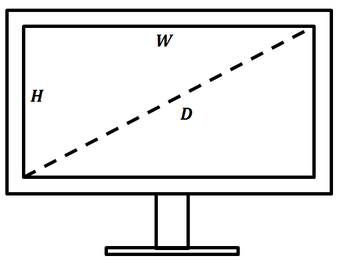
The size and shape of TV screens are specified by the length of the diagonal across the screen and the aspect ratio. Despite this, I believe that screen area is a much more intuitive unit for comparing TV sizes. The screen of a TV is rectangular, so we can find its area by multiplying the length of its height (H) and width (W).
The diagonal (D) is related to the TV screen’s height (H) and width (W) by the Pythagorean Theorem:
In addition, the aspect ratio (r) is an important descriptor of the TV screen’s shape. It gives the ratio of its width to height:
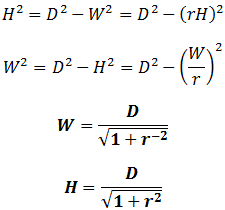
We now combine the two above expressions to calculate the height (H) and width (W) from diagonal length (D):
The overall area (A) of the screen is the product of its width and height:
Thus, the area (A) in terms of diagonal length and aspect ratio is given by:
Importantly, this equation reveals that screen area (A) increases with the square of screen diagonal (D). The area is also modified by aspect ratio, with maximum area at a 1:1 ratio. Since most modern TVs have an aspect ratio of 16:9, we can alternatively write:
TV cost is proportional to screen area
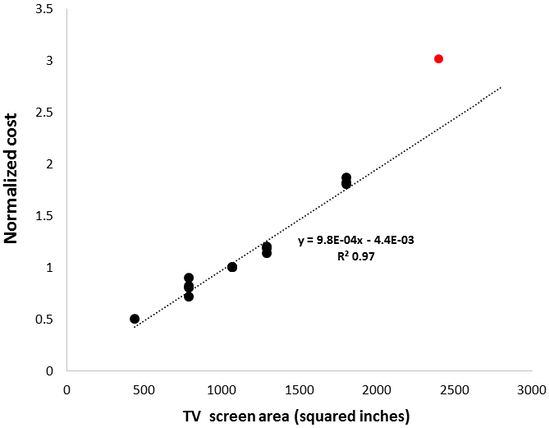
The relationship between screen area and diagonal length helps account for the nonlinearity between diagonal length and cost. The quantity of materials required for manufacturing scales with area rather than diagonal length, so it is sensible that screen area and cost may be proportional. This turns out to be an accurate assumption, as seen by replotting the normalized Samsung and LG series data against screen area.
There is a strong linear correlation between cost and screen area (R^2=0.97). For comparison, correlating cost with screen diagonal gave an inferior fit (R^2=0.88). A notable exception to this trend is the outlier at 75” diagonal length (red data point). The deviation at this large size is likely due to current manufacturing limitations, driving up the cost. According to the vice president of TV product marketing at Samsung, there are very few fabrication plants currently operating that are optimized for producing LCD panels of this size.
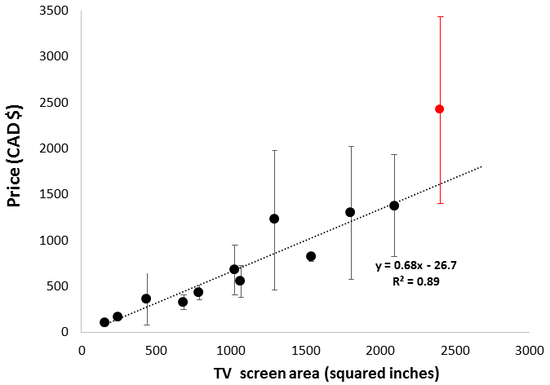
Having established the relationship between TV screen area and cost using controlled data, we can return to the total data set to gain more insights about TV prices. There was a large range of prices at each TV size, mostly due to the presence or absence of various features in the different models. If the availability of such features is fairly equal across TV sizes, averaging the prices at each size may largely cancel out this variability. I tried this, and it afforded a surprisingly strong linear correlation with screen area.
Having established the relationship between TV screen area and cost using controlled data, we can return to the total data set to gain more insights about TV prices. There was a large range of prices at each TV size, mostly due to the presence or absence of various features in the different models. If the availability of such features is fairly equal across TV sizes, averaging the prices at each size may largely cancel out this variability. I tried this, and it afforded a surprisingly strong linear correlation with screen area.
Given that these data are from averaging all of the TVs sold by Walmart, this is an impressive fit (R^2=0.89). Conversely, these data were less strongly correlated with screen diagonal (R^2=0.79). There are several implications of this. Firstly, it suggests my earlier observation that TV price is proportional to screen area is broadly applicable. In addition, it implies that expensive TV features are near equally represented across the range of sizes. Lastly, the 75” TVs are an outlier from this trend (red data point), reinforcing that this size of TV is disproportionally expensive in the current market.
Conclusion
Overall, the cost of TVs is proportional to screen area. TV prices are therefore “fair,” you pay the same cost per square centimeter of screen you get. The only exception to this is the largest screens (75” and above). These are disproportionately expensive, probably due to limitations of the current manufacturing practices. It is also interesting to consider pixels in light of this. For instance, a smaller 4K TV has the same pixel count as a larger one. Here the cost per pixel is higher for the larger TV, an understandable consequence of each pixel having to be made bigger.
The fairness of these prices may come as a surprise to many consumers, since each additional increase in diagonal length appears progressively more expensive. I have shown that this is merely a consequence of the relationship between diagonal length and area. Though geometrically straightforward, some consumers may not have considered this point. It is unfortunate that screen area is not widely used for comparing TV sizes. In addition to being more intuitive, it also simplifies comparing TVs of different aspect ratios. Though most modern TVs have a 16:9 aspect ratio, older TVs usually had a 4:3 ratio. In such cases comparison of diagonal lengths is particularly misleading.
The fairness of these prices may come as a surprise to many consumers, since each additional increase in diagonal length appears progressively more expensive. I have shown that this is merely a consequence of the relationship between diagonal length and area. Though geometrically straightforward, some consumers may not have considered this point. It is unfortunate that screen area is not widely used for comparing TV sizes. In addition to being more intuitive, it also simplifies comparing TVs of different aspect ratios. Though most modern TVs have a 16:9 aspect ratio, older TVs usually had a 4:3 ratio. In such cases comparison of diagonal lengths is particularly misleading.




 RSS Feed