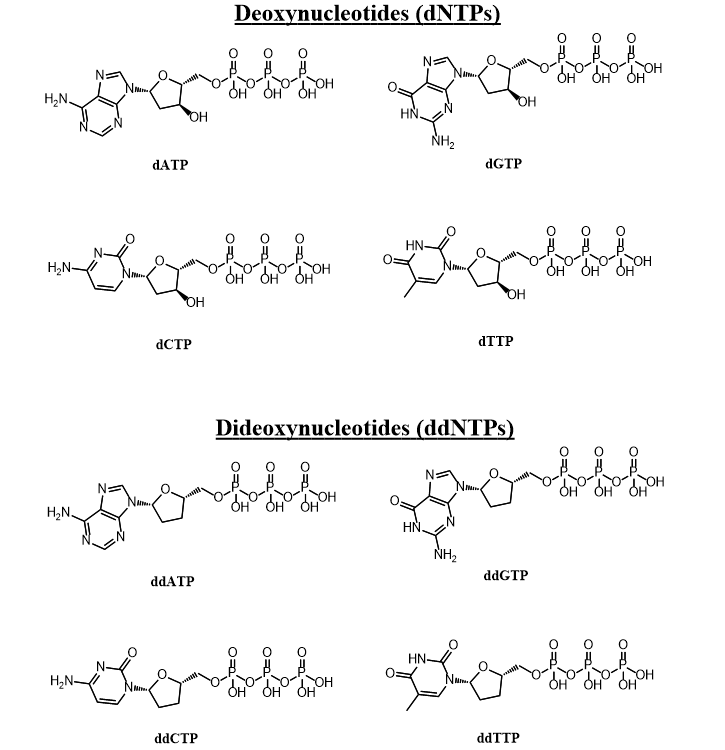
Sanger sequencing is a classical technique to determine the base pair sequence of DNA samples. The technique utilizes modified dideoxynucleotide tripshosphates (ddNTP) which lack a 3’ hydroxyl group. During normal DNA synthesis nucleotides get added sequentially. The new DNA strand contains a nucleophilic 3’ hydroxyl group which attacks the α-phosphate of the appropriate deoxynucleotide triphosphate (dNTP), resulting in its incorporation and the formation of a new phosphodiester bond. Since ddNTPs lack the nucleophile required for this reaction the elongation of the DNA strand is terminated as soon as a ddNTP is incorporated.
Sanger sequencing is done by carrying out DNA synthesis of the template DNA: a DNA polymerase, a DNA primer, and dNTP are required. A small amount of ddNTP is also included in the reaction mixture. One component of the synthesized DNA fragments must be labelled. For instance we could label each type of ddNTP (ddATP, ddCTP, ddGTP, and ddTTP) with different fluorescent tags. DNA synthesis of a new strand would continue until a ddNTP gets incorporated. Thus the ratio of dNTP to ddNTP determines the distribution of fragment lengths of DNA produced. After the reaction is complete the fragments are separated by polyacrylmimide gel electrophoresis, which separates them according to size. The sequence of nucleotides in the DNA can be inferred from the sequence of ddNTP types seen in the gel, as the ddNTP type reveal which nucleotide is present in each fragment’s 3’ end.
The ratio of dNTP to ddNTP used is critical for the success of Sanger sequencing since it determines the distribution of DNA fragment lengths produced. Despite this, I have been unable to find a detailed mathematical treatment of how this ratio affects the results. Thus, in the article I will explore the mathematical relationship between the dNTP to ddNTP ratio and the distribution of fragment lengths, and develop an equation to predict the optimum ratio under specified conditions. The accuracy of this model depends on the validity of the assumptions which I have made to develop it:
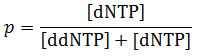
We can define p as the fraction of nucleotides triphosphates derivatives which are normal dNTP:
The ratio of dNTP to ddNTP used is critical for the success of Sanger sequencing since it determines the distribution of DNA fragment lengths produced. Despite this, I have been unable to find a detailed mathematical treatment of how this ratio affects the results. Thus, in the article I will explore the mathematical relationship between the dNTP to ddNTP ratio and the distribution of fragment lengths, and develop an equation to predict the optimum ratio under specified conditions. The accuracy of this model depends on the validity of the assumptions which I have made to develop it:
- The reaction goes fully to completion, all dNTP and ddNTP are used up, all strands being synthesized are terminated.
- The kinetics for the incorporation of a dNTP or a ddNTP are identical, both processes have identical rate constants.
- The DNA sample contains roughly the same amounts of guanosine, cytidine, adenosine, and thymidine, thus each nucleotide type will have the same optimum ratio of dNTP to ddNTP.
- The DNA sample being sequenced is long such that the fraction of fragments produced spanning the entire sequence is small.
- The separation from gel electrophoresis is ideal.
- No complicating secondary structure of DNA exists during sequencing.
We can define p as the fraction of nucleotides triphosphates derivatives which are normal dNTP:
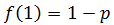
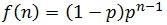
For each sequential nucleotide addition there is a chance of 1 - p that a ddNTP gets incorporated, terminating the chain. Alternatively there is a chance of p that a dNTP gets incorporated allowing the addition of nucleotides to continue. The resulting frequency (f) of DNA fragments containing n nucleotides is thus related to p by:

This is because each additional nucleotide added requires another dNTP rather than a ddNTP being incorporated, which has a probability of p of occurring. In the simple case of the first added nucleotide being a ddNTP:
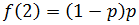
In the case of the first nucleotide being dNTP and the second being a ddNTP we must multiply the probability of each event:
Of course each additional nucleotide added to the fragment has a probability of p of being dNTP. We can continue this pattern to deduce that for a fragment of n nucleotides:
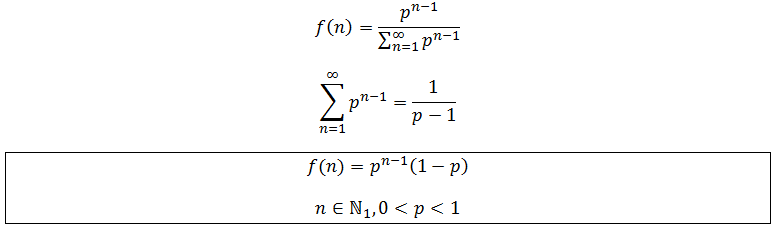
However, an alternative way to show this is to start with the proportionality between f and p^n and normalize to get the probability distribution:
The nature of the frequency distribution and its dependence on the value of p are demonstrated below in the plot of f(n) against n for p=0.5, 0.7 and 0.9:
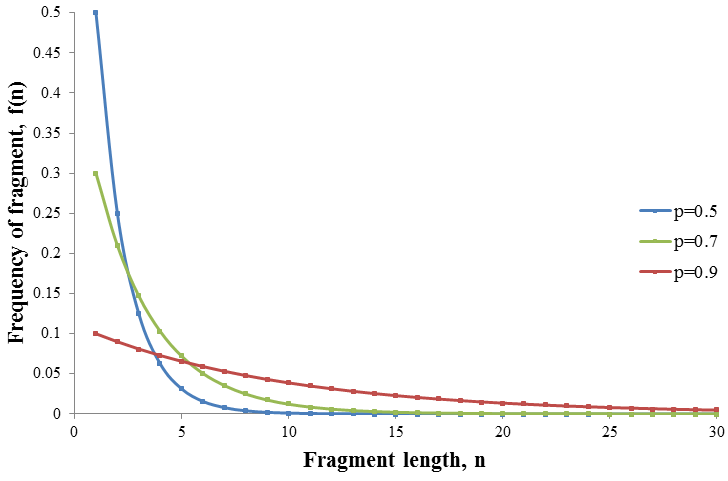
When a high amount of ddNTP is used (low p) fragments of only small length are produced but at high frequency. As the relative amount of ddNTP is decreased (increasing p) the frequency profile broadens. Thus the amount of ddNTP determines the shape of the frequency profile. It is first required to determine what the optimum frequency profile is before the optimum ratio of ddNTP can be found. In theory some amount of fragment at every length is produced given any amount of ddNTP. However in practice there is some amount of signal which is too small to be detected against the background noise. Thus only fragments whose amount exceeds some critical frequency, the detection limit (D), can be detected. The optimum frequency distribution would therefore be the one which has the maximum number of detectable fragments. This is because it would allow us to determine the largest number of base pairs of the DNA sequence. Consider the frequency profile examples given above, but now with a detection limit of D=0.1.
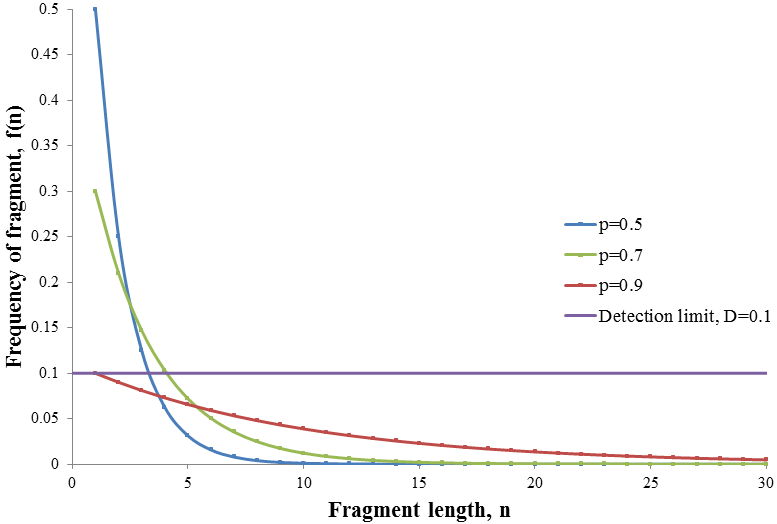
Among the frequency profiles shown, the p=0.7 case gives the largest number of fragment lengths above the detection limit. When p=0.9 the distribution is too spread out so that only the n=1 fragment is detectable. In contrast, the p=0.5 distribution is too narrow, the frequency of longer fragments is insufficiently small limiting the number that can be detected. Thus the optimum distribution is somewhere in between these extremes.
Note that f(n) is always maximum at n=1 (because p<1) and each term is successively smaller than the last. Thus for any distribution the number of detectable fragments will be equal to the length of the longest detectable fragment (n*). This length has the lowest frequency which is still above or equal to the detection limit:
Note that f(n) is always maximum at n=1 (because p<1) and each term is successively smaller than the last. Thus for any distribution the number of detectable fragments will be equal to the length of the longest detectable fragment (n*). This length has the lowest frequency which is still above or equal to the detection limit:
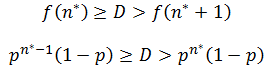
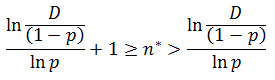
Now solving each side of the inequality for n* in terms of D:
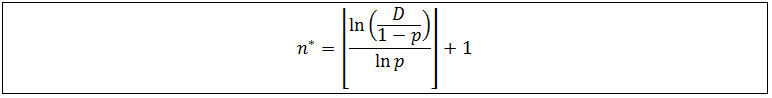
Recall that n* must be a natural number. Thus based on the above inequality the solution for n* requires use of the floor function, which rounds numbers down to the highest natural number below its current value.
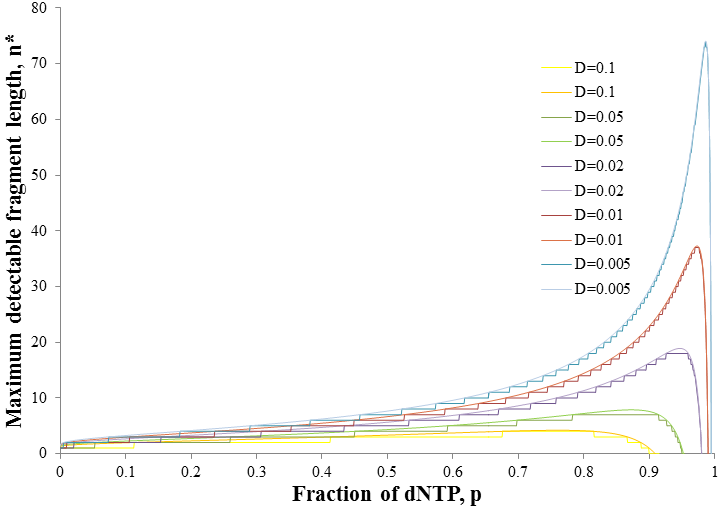
Since the only valid solutions for n* are natural numbers, obtaining a negative value for n* is an indication that all fragments are below the detection limit under those conditions. A plot of n* as a function of p at several detection limits follow below.
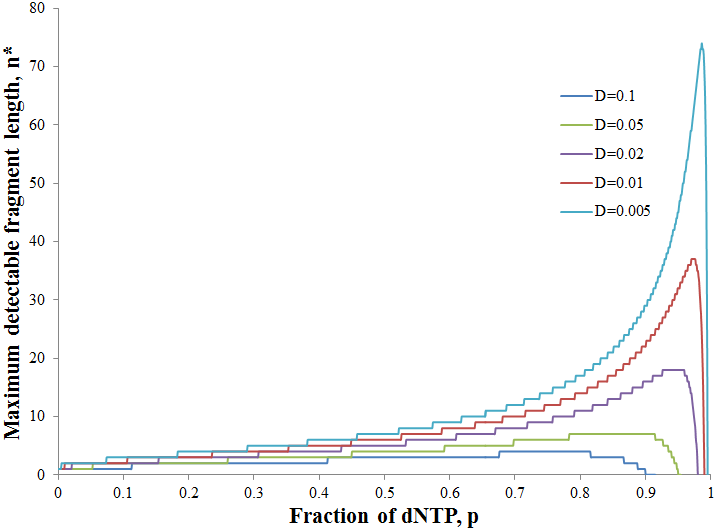
As we would intuitively expect, the value of n* increases as the detection limit is decreased. At each D value however, there is a distinct maximum in n* at a particular p value. As the detection limit is decreased the peak becomes larger and shifts to a higher p value. This tells us that at lower detection limits we are better off using a lower ratio of ddNTP to dNTP. This gives a broader distribution of fragments for which a larger number are above the detection limit. To be able to determine the ideal ratio of ddNTP to dNTP given a particular detection limit however, it would be useful to describe this more exactly with mathematics. We must find the p value at which n* is maximum. This can be done using the fact that the derivative of a function is zero at the maximum. However, this strategy is problematic since the expression for n* is discrete. We require a continuous function to apply differential calculus. Thus we must allow n to be any positive real number instead of a natural number for the sake of finding its derivative. In other words, we can omit the floor function in the expression for n*. This will still give valid results, observe below the maxima of the continuous and discrete forms of the function occur at the same p values:
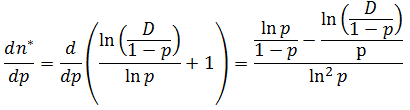
Now we can take the derivative of the function in its continuous form:
At maximum n*, p is at its optimum value (po):
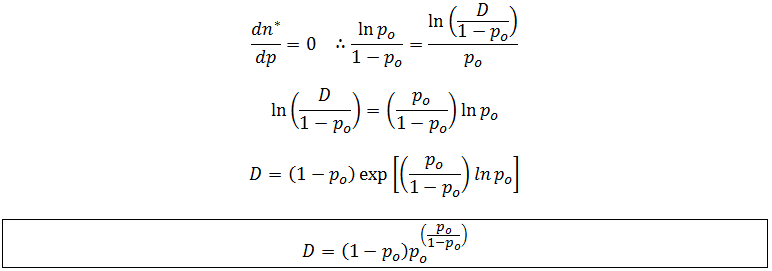
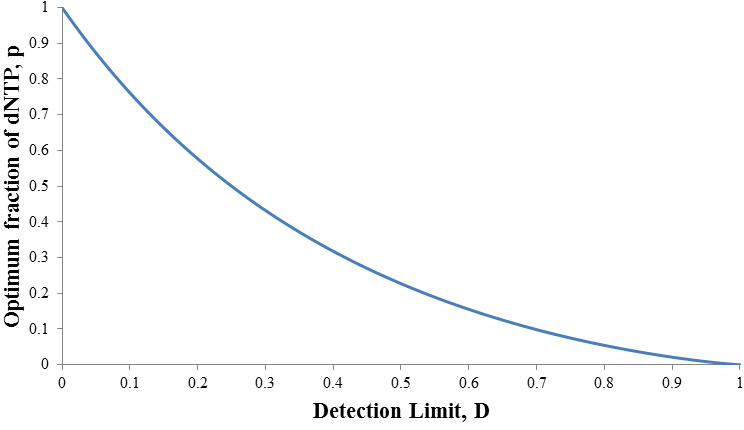
This expression allows the optimum fraction of dNTP to be calculated at any detection limit. Unfortunately its complexity makes it algebraically impossible to solve for po even though it is our independent variable. This is not a serious problem though, given any detection limit the value of po could be calculated numerically. As the detection limit is increased the optimum value of p decreases. In other words, the ratio of ddNTP to dNTP we should use increases. This is shown in the plot below:
It would be an interesting test of the model to try to predict the ideal ratio of ddNTP to dNTP under real experimental conditions. This value could then be compared with the experimentally determined optimum ratio. However, to do this an estimate of the detection limit of the DNA fragments is required, which seems elusive to determine. While my detection limit is in terms of the fraction of total fragments produced, a real detection limit would be in terms of an absolute amount/mass of DNA. Of course using higher concentrations of all reagents would yield a higher concentration of DNA fragments produced. However if too large an amount of DNA is used the resolution of the gel electrophoresis will be poor, as the bands could be too large to distinguish. Thus to fully predict the ideal conditions for Sanger sequencing a mathematical treatment of the gel electrophoresis separation would also be required. This would allow the optimum absolute concentrations of ddNTP and dNTP to be predicted. Despite this limitation, the goal of calculating their optimum ratio and determining how this ratio effects the distribution of fragment lengths was achieved.
 RSS Feed