Dialysis is a purification method commonly used in biochemistry to introduce or remove small molecules from a protein sample. In this technique the protein sample is placed in a dialysis bag submerged in dialysate, a solution containing the desired concentrations of small molecules. The dialysis bag’s membrane is semipermeable. It contains pores that allow small molecules to diffuse across it, but not larger molecules such as proteins.
In this article I develop equations to describe the progress of dialysis of a protein sample with respect to time. Through this, I demonstrate how the traditional dialysis protocol can be modified to maximize the rate of dialysis and minimize the volume of dialysate used. Traditional dialysis procedures involve having a dialysate volume much greater than that of the sample (typically at least 100x) and replacing it a one or more times with fresh dialysate. In contrast, I suggest placing the dialysis bag in a low-volume chamber with good mixing. Instead of replacing the dialysate a few times during the entire procedure, it is continuously exchanged by a constant flow of fresh dialysate through the chamber.
In this article I develop equations to describe the progress of dialysis of a protein sample with respect to time. Through this, I demonstrate how the traditional dialysis protocol can be modified to maximize the rate of dialysis and minimize the volume of dialysate used. Traditional dialysis procedures involve having a dialysate volume much greater than that of the sample (typically at least 100x) and replacing it a one or more times with fresh dialysate. In contrast, I suggest placing the dialysis bag in a low-volume chamber with good mixing. Instead of replacing the dialysate a few times during the entire procedure, it is continuously exchanged by a constant flow of fresh dialysate through the chamber.
Dialysis without dialysate replacement
For simplicity, I will only study the removal of a contaminant in a sample as a function of time during dialysis, starting with a concentration of 1 in the protein sample (CS) and a concentration of 0 in the dialysate (CD). However, the introduction of a small molecule into the sample is an equivalent situation and described just as well by the equations.
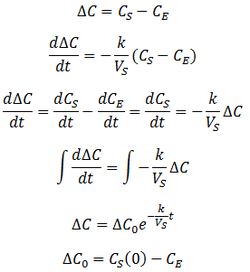
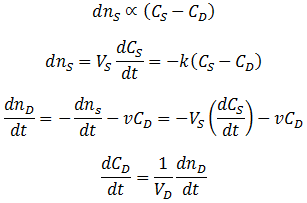
Suppose that we have a protein sample of volume VS in a dialysis bag, submerged in a volume VD of dialysate. During dialysis, the contaminant concentration in the sample decreases as it diffuses across the membrane into the dialysate. This net transfer occurs until equilibrium is reached where the dialysate and the sample contain the same concentration of contaminant. The rate of transfer is proportional to the concentration gradient, the difference between the concentration of contaminant in the dialysate and the sample. Equivalently, it is proportional to the difference between the sample’s concentration and the concentration at equilibrium. I assume that the rate constant (k) for diffusion across the membrane is an intrinsic property of the membrane, independent of the sample volume. Thus:
Suppose that we have a protein sample of volume VS in a dialysis bag, submerged in a volume VD of dialysate. During dialysis, the contaminant concentration in the sample decreases as it diffuses across the membrane into the dialysate. This net transfer occurs until equilibrium is reached where the dialysate and the sample contain the same concentration of contaminant. The rate of transfer is proportional to the concentration gradient, the difference between the concentration of contaminant in the dialysate and the sample. Equivalently, it is proportional to the difference between the sample’s concentration and the concentration at equilibrium. I assume that the rate constant (k) for diffusion across the membrane is an intrinsic property of the membrane, independent of the sample volume. Thus:
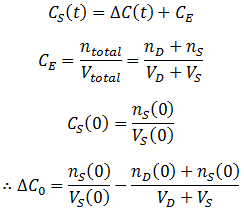
However, we are trying to follow the removal of the contaminant from the sample. Therefore, it is more useful to express this in terms of CS, the concentration in the dialysis bag:
In deriving this equation I have neglected the effect of osmosis. If the osmolarity of the protein sample and the dialysate are different, then there will be net flow of water via osmosis until both the sample and the dialysate have the same osmolarity. The progress of this would also follow an exponential decay, like removal of the contaminant. Osmosis would change the sample and dialysate volumes over time, causing a slight deviation away from the concentration predicted by the above equation. Therefore, this model assumes that the amount of osmosis is small: that the osmolarity of the dialysate and the sample are similar.
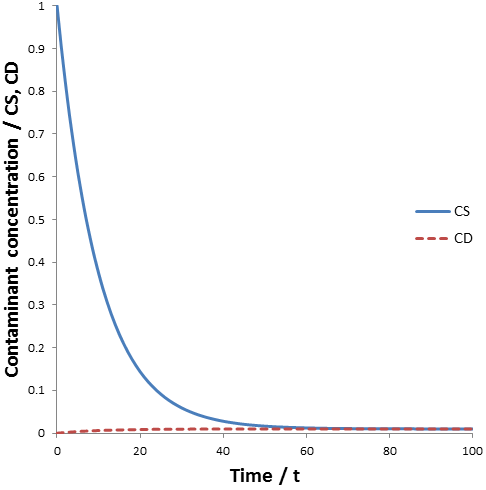
The figure below shows the contaminant concentration in the sample and the dialysate as a function of time given: CS(0)=1, CD(0)=0, VS=1, VD=100, and k=0.
The figure below shows the contaminant concentration in the sample and the dialysate as a function of time given: CS(0)=1, CD(0)=0, VS=1, VD=100, and k=0.
The concentration of contaminant in the sample decreases according to an exponential decay, approaching the equilibrium concentration (0.0099). Likewise, the concentration of contaminant in the dialysate also approaches this equilibrium concentration. The problem with not replacing the dialysate is clear: as dialysis proceeds the contaminant accumulates in the dialysate. Hence, the maximum dilution of contaminant is limited by the equilibrium concentration of the system. The maximum dilution factor (D) which can be obtained using a given volume of dialysate is:
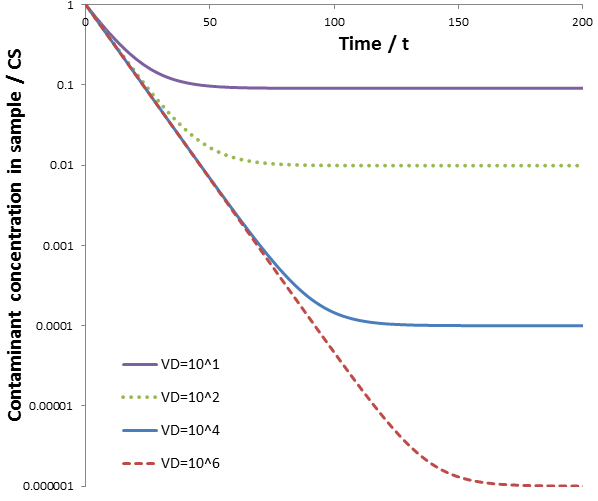
If we desire a larger dilution factor (D) one solution is to increase VD. Note that when VD >> VS it follows that VD/VS ≈ D. This approach is illustrated below. The calculations are performed over a range of dialysate volumes (VD). The other parameters used were: CS(0)=1, CD(0)=0, VS=1, and k=0.1.
Initially, the rate of contaminant removal is the same for all dialysate volumes; all curves follow the same linear line. Note that the y-axis is a logarithmic scale. Hence, linear lines indicate that CS decreases according to an exponential decay. This maximum rate occurs when the dialysate’s contaminant concentration is small compared to the concentration in the sample. However, as CS decreases and CD increases it is eventually no longer true that CD << CS. This reduces the rate of dialysis, causing the curves to deviate from linearity. Increasing the dialysate volume decreases the rate at which CD increases, extending the region where CS decreases by an exponential decay. Using a larger volume of dialysate therefore increases the rate of dialysis and the dilution factor that can be obtained. However, this approach is not always practical, such as when a large dilution factor of a contaminant is required. For instance, if we seek a 10^6 dilution of contaminants, we then require 10^6 times the amount of dialysate as sample. For instance, for a 5 mL protein sample we would need 5000 L of dialysate! This would certainly be a wasteful and unfeasible approach.
Dialysis with discrete dialysate replacements
I have shown that the limitations of using the same dialysate without replacement are substantial. The concentration of contaminant in the sample approaches the equilibrium concentration of the system rather than zero. The volume of dialysate limits the maximum dilution of the contaminant. Furthermore, as the system approaches equilibrium the rate of dilution decreases.
A commonly used strategy to overcome these issues is to replace the dialysate with the same volume fresh dialysate one or more times throughout the procedure. When the dialysate (at t=tC) is changed (at t=tc) the equilibrium concentration of the system is reduced since all of the contaminant in the dialysate is removed from the system:
A commonly used strategy to overcome these issues is to replace the dialysate with the same volume fresh dialysate one or more times throughout the procedure. When the dialysate (at t=tC) is changed (at t=tc) the equilibrium concentration of the system is reduced since all of the contaminant in the dialysate is removed from the system:
Thus, CS(t) becomes a piecewise function:
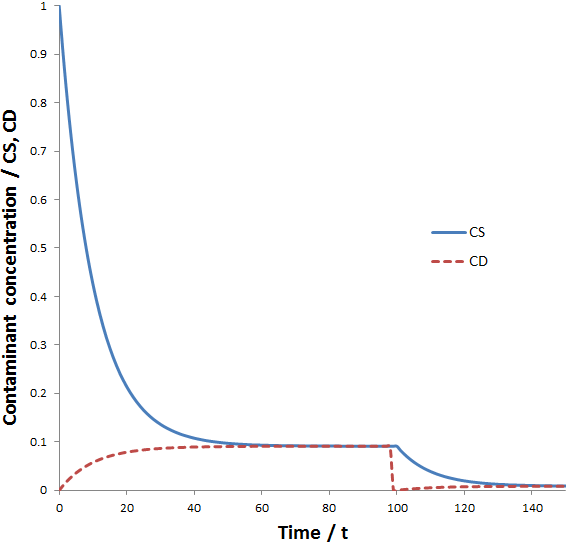
The properties of these equations are illustrated in the figure below where the calculations were done using the parameters: CS(0)=1, CD(0)=0, VS=1, VD=10, k=0.1, and tc=100.
By the time t=60, CS ≈ CD, preventing CS from further decreasing with time. However, when the dialysate is replaced (at t=100) the concentration of contaminant in the dialysate is reset to zero, allowing another exponential decay to a lower equilibrium concentration. Therefore, a higher dilution factor can be obtained than without dialysate replacements given the same total dialysate volume. If we allow equilibrium to be reached before each dialysate replacement, the maximum dilution factor (D) that can be attained is for n dialysate replacements is:
Thus, it can be advantageous to do multiple dialysate changes. The generalized expression for CS(t) given n dialysate changes is:
Dialysis with continuous dialysate replacement
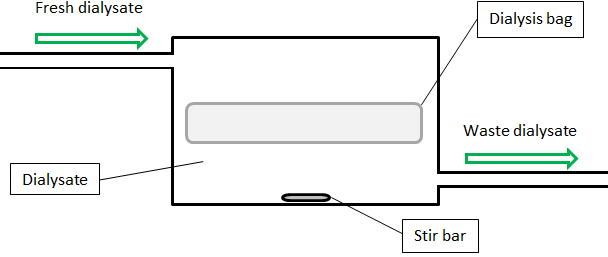
We have seen that dialysate replacements can reduce the required dialysate volume and increase the speed at which dialysis proceeds. Thus, dialysis protocols can be optimized through frequent dialysate replacements. Manually replacing the dialysate frequently is time-consuming though. Nevertheless, I argue that the optimum procedure would be to replace it constantly. I propose that a specially designed instrument could automate this, requiring minimum human labour. The dialysis bag would be submerged in a chamber filled with dialysate (a volume of VD) with constant vigorous mixing, for instance via a stir bar. Fresh dialysate is pumped into the chamber at a constant flow rate (v), dialysate exits the chamber on the other end at the same rate. A schematic of the design follows below.
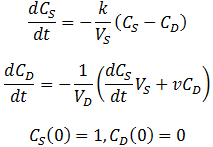
In this case, the equilibrium concentration of the system (CE) changes constantly with time as the dialysate is replaced with fresh dialysate at a flow rate of v. In deriving the expression for CS(t), CE is no longer constant so we must now rely on this alternative, but equivalent, proportionality:
Exact algebraic solutions to this system of ordinary linear differential equations exist, although deriving them by hand is not feasible. Instead, I was able to get the exact solutions using the dsolve command in Maple 2015. It turns out that the form of the solutions to this system is relatively simple, both the expressions for CS(t) and CD(t) consist of two exponential terms added together. However, the exact values of the coefficients are extremely complicated functions of the parameters VS, VD, k, and v. For instance, given the parameters VD=100, k=0.1, VS=1, v=0.1, the equations for CS(t) and CD(t) are:
When the flow rate, v, is increased to 1000, the equations become:
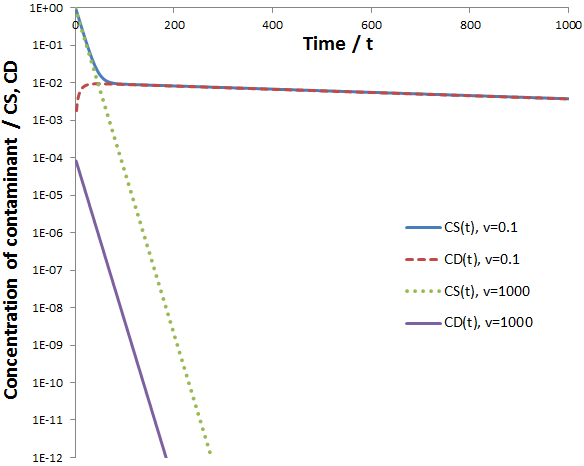
To study the behavior of these equations they are plotted below:
At a very high flow rate (v=1000) the dialysate’s concentration of contaminant is consistently several orders of magnitude below that of the sample, thus its concentration in the sample decreases exponentially indefinitely (the scale above is logarithmic, exponential functions appear linear). In contrast, given a low flow rate (v=0.1) two distinct phases are observed in the rate of contaminant removal. Initially it decreases exponentially at the same rate as at high flow rate. However, this then switches to a second, much slower exponential decay. These results are explained below.
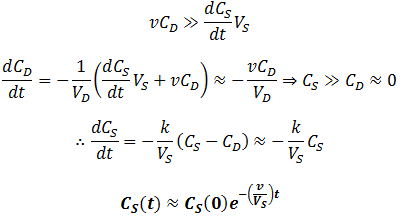
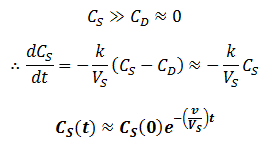
Given a very high flow rate, the dialysate is replaced so quickly that the contaminant does not have time to accumulate. That is, throughout the procedure:
Given a very high flow rate, the dialysate is replaced so quickly that the contaminant does not have time to accumulate. That is, throughout the procedure:
In other words, only the rate at which contaminant can diffuse across the dialysis bag is rate-limiting, all contaminant in the dialysate is promptly washed away by the high flow rate. Conversely, consider a low flow rate. Since CD(0)=0, we will still initially have:
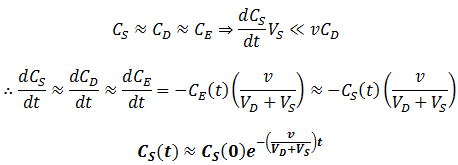
However, the low flow rate means that removal of the solute from the dialysis buffer is slow. Hence, the contaminant will eventually accumulate in the dialysate, limiting the rate at which the rate it can be removed from the sample. That is,
Thus, at slow flow rate the profile of CS versus time would have two distinct phases: first, the contaminant quickly flows into the dialysate until equilibrium is reached. During this phase, diffusion across the dialysis membrane is rate-limiting. Next, CS decreases at a much slower rate, approaching zero. Here transport of the contaminant out of the dialysate (by replacement with fresh dialysate) is rate-limiting. Thus, the two components can be approximated quite well by:
The simplicity of this equation is impressive, when compared to exact solution to the differential equations found by Maple:
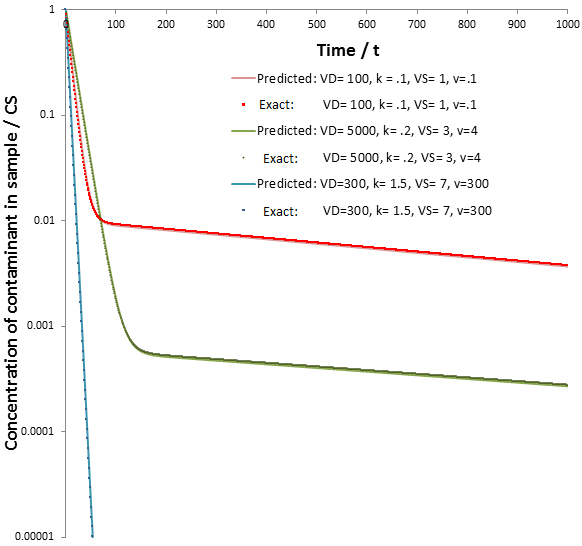
Despite the simplicity of the approximation, the values of CS(t) calculated according to each are in good agreement. Observe below, where CS is plotted as a function of time for the exact and approximate (predicted) solutions given different sets of parameters.
It is impressive that such a relatively simple approximation can match the behavior of the real equation so closely. The rate of dialysis is dominated by whichever step is rate-limiting step: diffusion across the semipermeable membrane or the rate of dialysate exchange. The rate of diffusion across the membrane is determined by the properties of the membrane, the temperature, and the rate of stirring. It is therefore straightforward how we can maximize this: using a membrane with high porosity and surface area and using a high rate of stirring. In contrast, we can maximize the rate of dialysate replacement by increasing the flow rate. There are physical limitations on the former, such the maximum porosity the dialysis membrane can have. In contrast, the flow rate through the chamber can be increased without bound. Thus, to maximize the rate of dialysis we should ensure diffusion across dialysis membrane is solely rate-determining. Thus, for all t, we seek:
However, we also wish to use minimum dialysate. The total dialysate volume (VTD) used is:
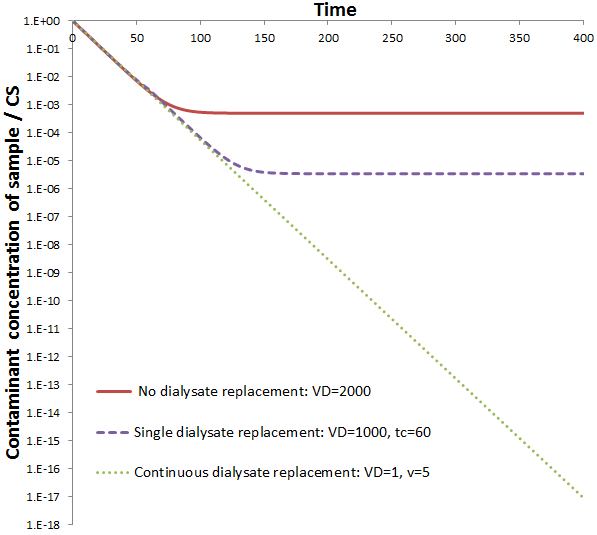
We can decrease v and VD together to decrease the volume of total dialysate volume used while maintaining above inequality. Thus, using constant dialysate replacement it is possible to attain a higher rate of dilution of contaminant while also reducing the volume of dialysate used. To demonstrate this, the value of CS is plotted against time given continuous dialysate replacement (with VD=1, v=5) compared to a single dialysate replacement (using VD=1000) or no dialysate replacement (with VD=2000).
Initially, all cases follow the same linear line. Note that the scale is logarithmic, as before linear lines represent exponential decays. At the beginning the rate of dialysis is maximum: diffusion across the dialysis membrane is solely rate-determining because the concentration of contaminant in the dialysate is small. When the dialysate is replaced once or not at all, the curves eventually deviate away from linearity to slower rates of dialysis, subsequently stopping entirely. This is because contaminant accumulates in the dialysate. Unlike the others though, continuous dialysate replacement results in the exponential decay continuing indefinitely, as seen by the continuing linear line. The flow of fresh dialysate, much higher than the dialysate volume, continuously washes away contaminant from the dialysate so that diffusion across the membrane is always solely rate-determining. That is, the maximum rate of dialysis is achieved throughout the procedure.
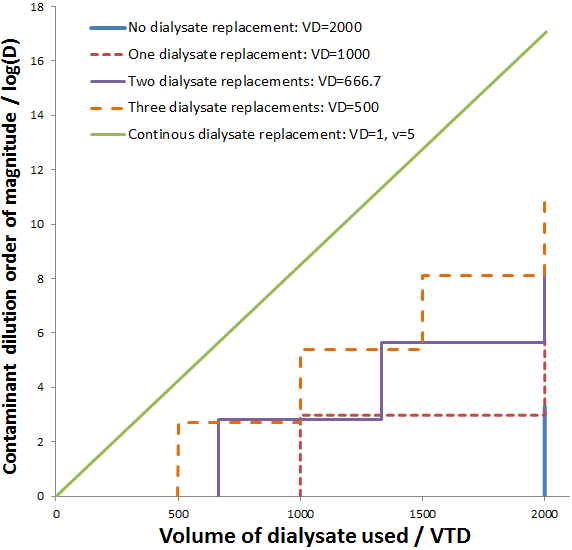
Impressively, this high rate of dialysis is attained while using a smaller volume of dialysate. The dilution of contaminant obtained for continuous dialysate is compared to discrete dialysate replacements below. The maximum dilution obtainable is plotted for the discrete dialysate replacements (given the system reaches equilibrium before the replacement). This is calculated, as before, according to:
Impressively, this high rate of dialysis is attained while using a smaller volume of dialysate. The dilution of contaminant obtained for continuous dialysate is compared to discrete dialysate replacements below. The maximum dilution obtainable is plotted for the discrete dialysate replacements (given the system reaches equilibrium before the replacement). This is calculated, as before, according to:
Indeed, continuous dialysate replacement results in a superior factor of dilution using a given volume of dialysate. As the number of discrete replacement steps is increased the obtainable dilution factor for a given total dialysate volume increases. The curve approaches a linear line as the number of replacement steps approaches infinity (continuous replacement).
This modification, continuous dialysate replacement, therefore is superior to the traditional dialysis protocol with respect to both the rate and the amount of dialysate used. The disadvantage is that a relatively complex apparatus is needed, which could be quite expensive to construct. However, once built the procedure could be automated by computer, requiring even less human intervention than the traditional protocol where manually changing the dialysate is necessary. My modification could be particularly useful for the purification of relatively unstable proteins, since it may decrease the time needed to attain a given dilution factor of contaminant. This strategy could also be especially beneficial when purifying proteins on an industrial scale. In this case, very large volumes of dialysate would be used. Thus, the decrease in dialysate volume required by this approach could be quite significant, potentially lowering the cost considerably.
This modification, continuous dialysate replacement, therefore is superior to the traditional dialysis protocol with respect to both the rate and the amount of dialysate used. The disadvantage is that a relatively complex apparatus is needed, which could be quite expensive to construct. However, once built the procedure could be automated by computer, requiring even less human intervention than the traditional protocol where manually changing the dialysate is necessary. My modification could be particularly useful for the purification of relatively unstable proteins, since it may decrease the time needed to attain a given dilution factor of contaminant. This strategy could also be especially beneficial when purifying proteins on an industrial scale. In this case, very large volumes of dialysate would be used. Thus, the decrease in dialysate volume required by this approach could be quite significant, potentially lowering the cost considerably.













 RSS Feed